Format the labels on the x-axis, y-axis, or both
Usage
scale_xy_percent(..., accuracy = 1)

scale_x_percent(..., accuracy = 1)

scale_y_percent(..., accuracy = 1)

scale_xy_comma(..., log10 = FALSE)

scale_x_comma(..., log10 = FALSE, accuracy = NULL)

scale_y_comma(..., log10 = FALSE, accuracy = NULL)Examples
library(ggplot2)
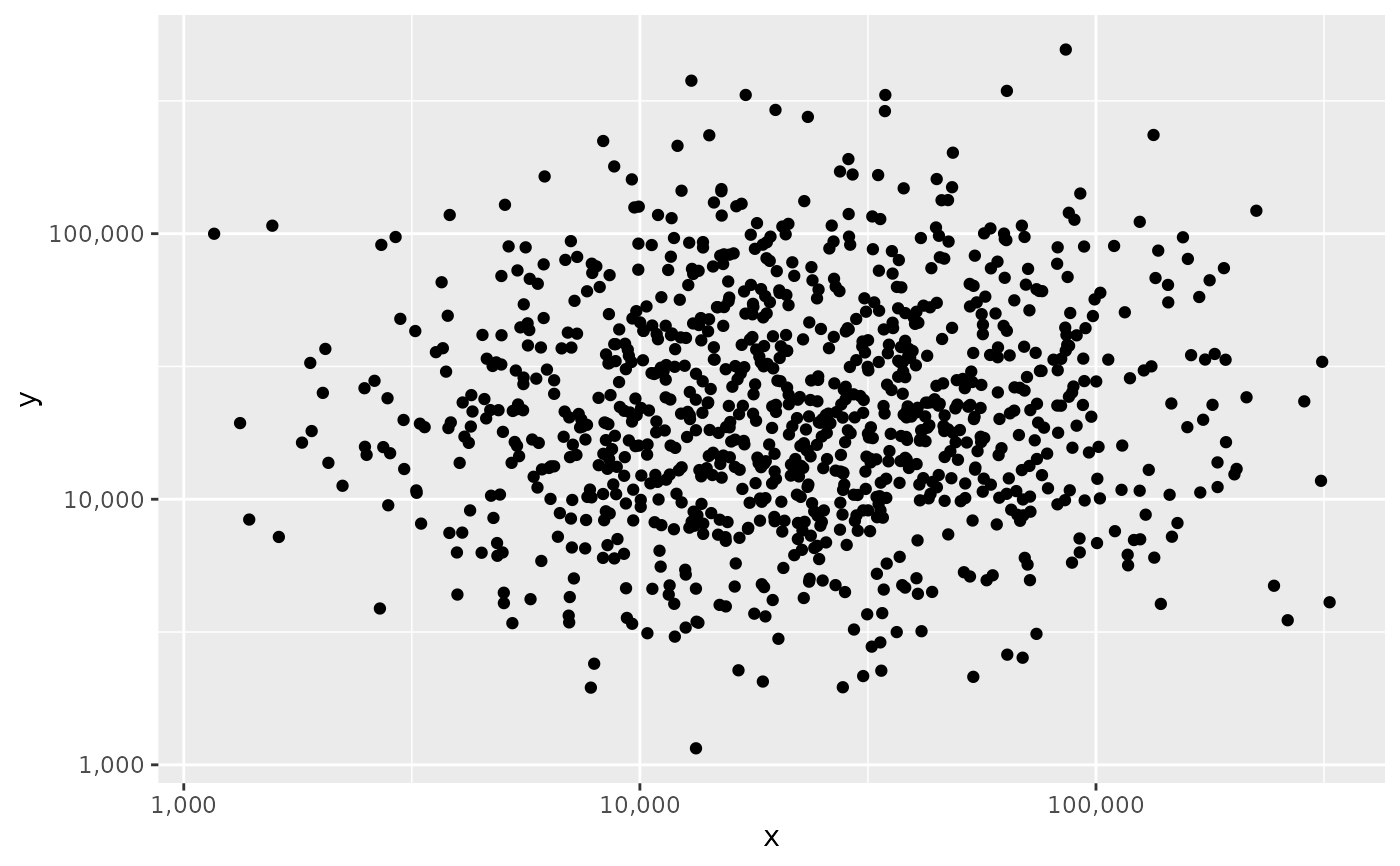
# quickly add comma format to x/y scales
tibble::tibble(x = rlnorm(1e3, 10),
y = rlnorm(1e3, 10)) |>
ggplot(aes(x, y)) +
geom_point() +
scale_xy_comma(log10 = TRUE)
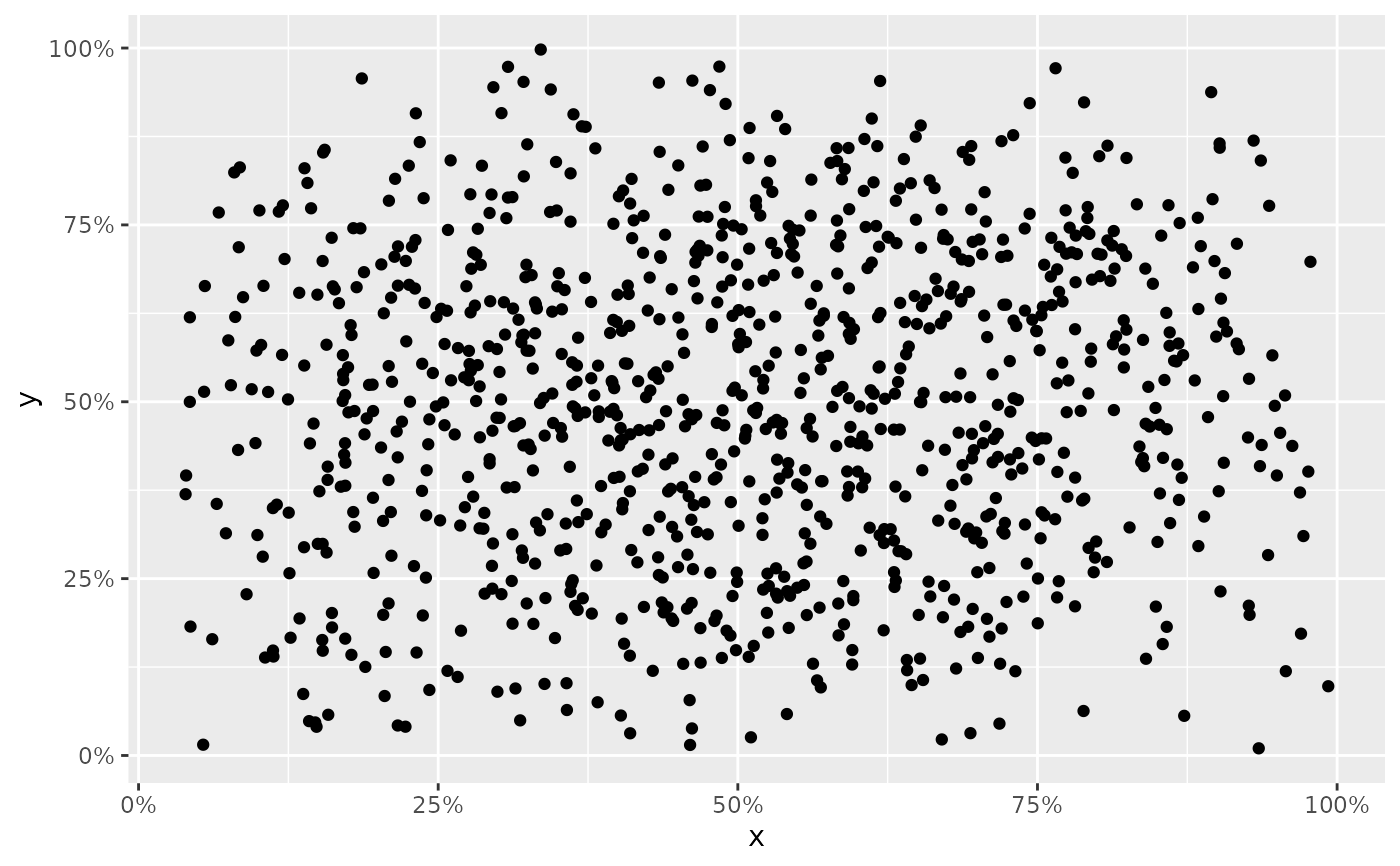
 # quickly add percent format to x/y scales
tibble::tibble(x = rbeta(1e3, 2, 2),
y = rbeta(1e3, 2, 2)) |>
ggplot(aes(x, y)) +
geom_point() +
scale_xy_percent()
# quickly add percent format to x/y scales
tibble::tibble(x = rbeta(1e3, 2, 2),
y = rbeta(1e3, 2, 2)) |>
ggplot(aes(x, y)) +
geom_point() +
scale_xy_percent()